To achieve long-term investment returns through capital growth, primarily in equity securities of large to medium-sized Canadian issuers.
Minimum Initial Investment:
Lump Sum
Initial: $500
Subsequent: $100
| Inception Date | Nov 24, 2005 |
|---|---|
| Fund Code | ATL022 |
| Assets Under Management ($000) As at : September 30, 2025 | $1,787,640 |
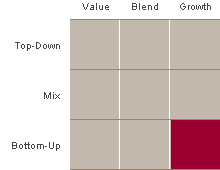
Investment Style

| 3 mo | 6 mo | YTD | 1 yr | 3 yrs | 5 yrs | 10 yrs | Since Inception |
|---|---|---|---|---|---|---|---|
| 7.8% | 18.1% | 16.8% | 22.4% | 18.3% | 15.0% | 11.0% | 6.8% |
As at: September 30, 2025 Performance figures are net of fees.
| 2024 | 2023 | 2022 | 2021 | 2020 | 2019 | 2018 | 2017 | 2016 | 2015 |
|---|---|---|---|---|---|---|---|---|---|
| 23.5% | 9.8% | (7.3%) | 23.7% | 14.00% | 21.7% | (10.6%) | 7.1% | 17.8% | (8.4%) |
The rate of return or mathematical table shown is used only to illustrate the effects of the compound growth rate and is not intended to reflect future values of the fund or returns on investment in the fund.
†Please refer to the Annual/Interim Management Reports of Fund Performance for further details.
This material is provided for general informational purposes only and does not constitute financial, investment, tax, legal or accounting advice nor does it constitute an offer or solicitation to buy or sell any securities referred to.
Commissions, trailing commissions, management fees and expenses all may be associated with mutual fund investments. Please read the simplified prospectus before investing. To obtain a copy of the simplified prospectus, call 1-888-888-FUND (3863). Alternatively, you may obtain a copy from your advisor.
Any information or discussion about the current characteristics of this mutual fund or how the portfolio manager is managing the mutual fund that is supplementary to information in the prospectus is not a discussion about material investment objectives or strategies, but solely a discussion of the current characteristics or manner of fulfilling the investment objectives and strategies, and is subject to change without notice.
The indicated rates of return are the historical annual compounded total returns including changes in unit value and reinvestment of all distributions, but do not take into account sales, redemption, distribution or optional charges or income taxes payable by any unitholder that would have reduced returns.
Mutual fund securities are not covered by the Canada Deposit Insurance Corporation or by any other government deposit insurer, nor are they guaranteed.
Past performance may not be repeated and is not indicative of future results.
The material and/or its contents may not be reproduced without the express written consent of CIBC Asset Management Inc.


